
GPU Depreciation: Accounting Life vs Economic Life
The short version
Depreciation schedules get the length of a GPU's life about right. They get the shape wrong.
A GPU node keeps earning cash long after a 3- or 5-year schedule writes it to zero. Its value doesn't glide down a line. It moves in jumps, set by rental-rate cycles and NVIDIA launches.
Lenders have already priced this in. Just not in the schedule. In our deal flow, nobody lends against GPUs past 48 months. That tenor cap is the market's real estimate of economic life.
Run a typical 2023 H100 node through it. A 48-month loan at 70% of cost hit 92% LTV on estimated economic value at the October 2025 trough. The 6-year book said 55%. The short tenor is what kept the loan above water. After month 48, the risk belongs to the lessor and whoever carries the residual.
The accounting view: 5–6 years, straight-line
Hyperscalers and neoclouds depreciate GPU servers over five to six years, no salvage. Most have lengthened lives. One has shortened them.
| Company | Server useful life | Last change | Source |
|---|---|---|---|
| Amazon | 5 yrs (subset of servers) | Cut from 6 → 5 yrs, effective Jan 2025. Added $1.4B of FY2025 depreciation. | Amazon FY2025 10-K |
| Meta | 5.5 yrs | Extended from 4–5 yrs, Jan 2025. About $2.9B lower 2025 depreciation. | Global Data Center Hub |
| Alphabet | 6 yrs | Extended from 4 yrs, 2023 | Mora / All on the Line |
| Microsoft | 6 yrs | Extended, 2022 | Mora / All on the Line |
| CoreWeave | 6 yrs | Extended from 4 yrs, 2023 | CNBC |
The bear case belongs to Michael Burry. He puts the real life of this hardware at two to three years, and estimates about $176B of understated depreciation across the industry from 2026 to 2028 (Deep Quarry).
Here is why a lender should care. Book value flows straight into credit documents. A CoreWeave credit agreement on file with the SEC defines the "GPU Depreciated Amount" as 6-year straight-line under GAAP (SEC 8-K exhibit). Once the schedule feeds the borrowing base, the schedule is a credit decision.
The market view: rates cycle, they don't decay
Straight-line assumes earning power falls by the same dollars every year. H100 contract rates did something else.
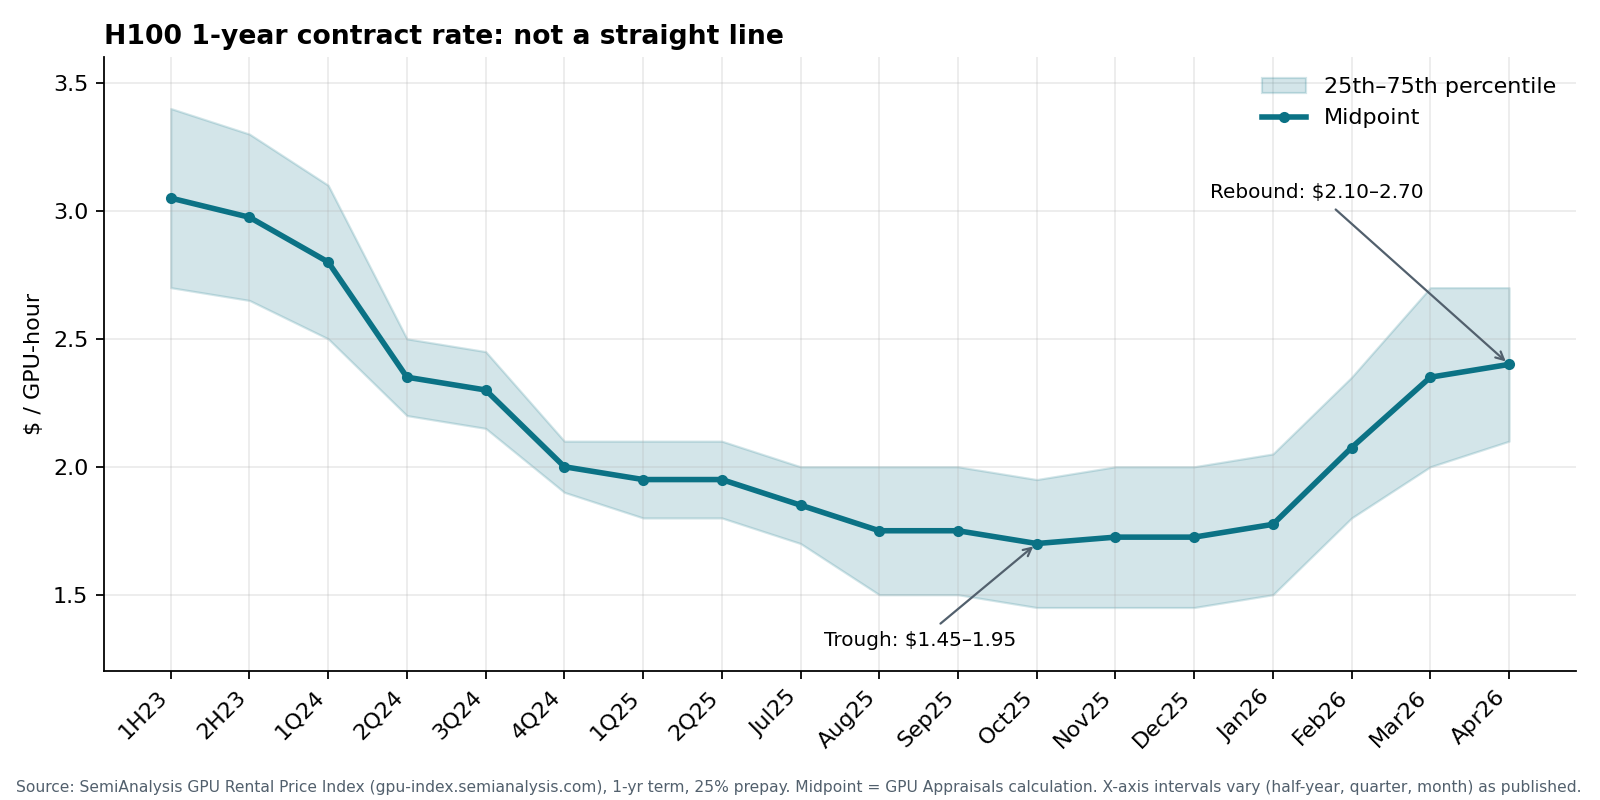
The SemiAnalysis 1-year H100 contract index (dashboard) shows three phases:
| Period | 1-yr contract range ($/GPU-hr) | Move |
|---|---|---|
| 1H 2023 | $2.70–3.40 | Launch scarcity |
| Oct 2025 | $1.45–1.95 | Trough, about −45% vs launch (midpoint, est.) |
| Apr 2026 | $2.10–2.70 | Rebound, about +40% off the low |
The rebound was demand, not supply. Agentic and inference workloads soaked up spare capacity. The memory price spike pushed server costs up and slowed new builds (SemiAnalysis, Apr 2026). SemiAnalysis saw H100s renewing at the rates they signed two and three years earlier, some for four more years, out to 2028. CoreWeave's CEO said a block of expiring 2022 H100 contracts rebooked at 95% of the original price (CNBC).
The newest print is from AWS. From October 7 it raises EC2 Capacity Block rates about 15%: H100 from $5.191 to $5.970 per GPU-hour, B300 from $14.04 to $16.146, and the six-year-old A100 goes up too (AWS). These are AWS reservation rates, not a market index. They show earning power, not resale value. Separately, Amazon is reportedly in talks to move about $8B of Grace Blackwell chips into an investor-funded vehicle and lease them back (Reuters, citing the FT). Talks only, and the chips are new Blackwell, not H100s, but the playbook is aircraft finance: fund the asset outside the company, lease it back, and leave the residual for someone to value.
No schedule written at purchase predicts a 45% drop and a 40% recovery on a 3-year-old asset. Economic value follows the rate. Book value never looks at it.
Current rates and residuals by generation
| GPU | Approx. age | Current rental rate | Secondary-market value | Read |
|---|---|---|---|---|
| A100 | ~6 yrs | $1.76/GPU-hr on-demand median, Sep 2026 (AIMultiple) | Card listings from ~$7.8K (40GB refurb) to ~$18.9K (80GB PCIe) (Hashrate Index) | Past every 3–5-yr schedule and still earning |
| H100 | ~3 yrs | $2.10–2.70 1-yr contract, Apr 2026 (SemiAnalysis). $2.53 on SDH100RT (Silicon Data). $2.92 on OCPI, Sep 24 (Ornn). | Used $15–28K per card, about 60–70% of new (Compute Exchange). Refurb $18–22K (Mercatus). | Liquid, but exposed to a Rubin-driven reset |
| H200 | ~2 yrs | $4.40/GPU-hr on-demand median, Sep 2026 (AIMultiple) | Thin; no reliable public print | Priced on income approach only |
| B200 | ~1–1.5 yrs | $3.68 SemiAnalysis composite, Apr 2026 (SemiAnalysis) | Effectively none | Priced on income approach only |
| Vera Rubin | New | First shipments Q3 2026, volume ramp Q4, growth into 1H 2027 (Wccftech; NVIDIA) | — | The next repricing event for Hopper and Blackwell |
One caution on the rate column. These sources measure different things: on-demand listings, contract surveys, transaction indices. Pick one benchmark, match it to the lease tenor, and stay with it.
Per Mercatus, a fast Blackwell ramp pushes 36-month H100 residuals toward 40% of cost. A slow one holds them at 65–75% (Mercatus). Rubin runs the same test one generation later. For fair market value against an actual executed sale on the same H100 equipment, see our H100 residual-value post.
Book value vs economic value, one node
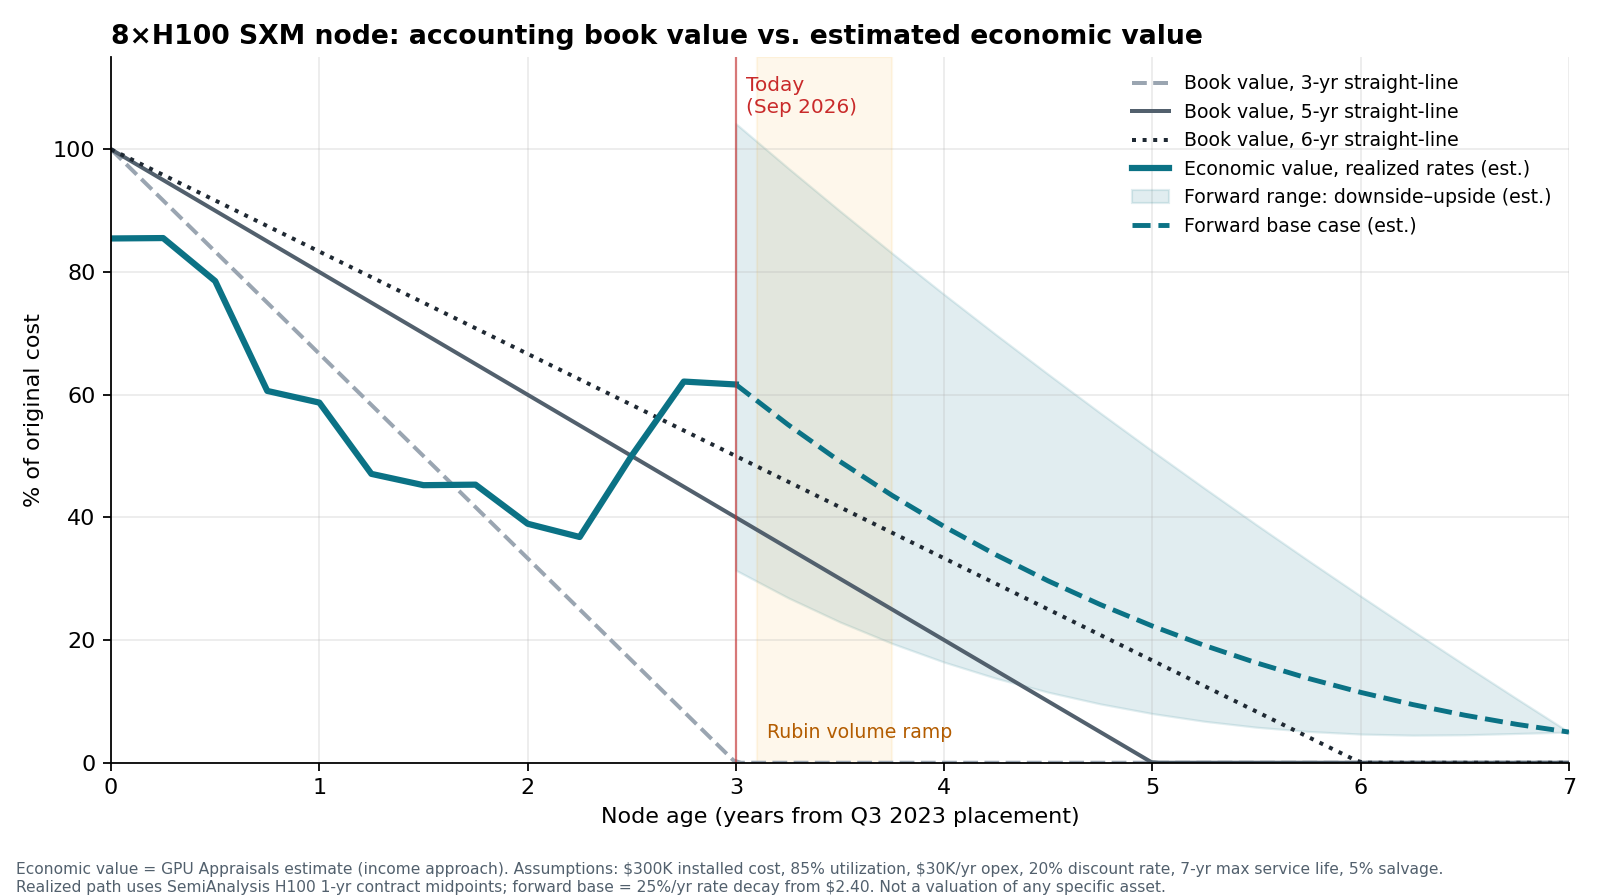
Take an 8×H100 SXM node placed in service in Q3 2023 at an assumed $300K installed.
Economic value here is our estimate on an income approach: the present value of the node's remaining net rental cash flow at each date, at the rate prevailing on that date. Assumptions are under the chart.
| Node age | 3-yr SL book | 5-yr SL book | 6-yr SL book | Economic value (est.) |
|---|---|---|---|---|
| 0 (Q3 2023) | 100% | 100% | 100% | 85% |
| 2.25 (Oct 2025 trough) | 25% | 55% | 63% | 37% |
| 3.0 (today) | 0% | 40% | 50% | 62% (range 31–104%) |
| 4.0 | 0% | 20% | 33% | 39% (range 16–76%) |
| 5.0 | 0% | 0% | 17% | 22% (range 8–51%) |
All economic values are estimates. Ranges run downside to upside. Downside: rates revert to the Oct 2025 low of $1.70, then fall 30% a year. Upside: $2.70, then 12% a year.
Three things jump out.
The book was too high at the trough. In October 2025 the 5- and 6-year schedules carried the node at 55–63% of cost. Estimated economic value was 37%.
The book is too low today. After the rebound, economic value sits around 62%, above both the 5-year book (40%) and the 6-year (50%). The 3-year schedule already wrote it off.
And useful life outruns every schedule. At about $30K a year of opex, the node covers its cash costs at roughly $0.50 per GPU-hour (estimate). Even the downside case stays cash-positive past year six. The risk isn't the box dying. It's the value swinging.
Straight-line is the wrong shape for GPU collateral. Real value drops fast early, swings with the rate cycle, then runs a long, thin tail.
Worked example: what this does to LTV
In our deal flow, GPU lenders stop at 48 months, whatever the book life says. That cap is the market's own read of economic life. It's shorter than every GAAP schedule above.
So assume a lender advances 70% of cost ($210K) at 10%, fully amortizing over 48 months. About $5.3K a month. Same loan, five collateral marks.
October 2025 (month 27). Loan balance: $102K
| Collateral basis | Value | LTV |
|---|---|---|
| 5-yr SL book | $165K | 62% |
| 6-yr SL book | $188K | 55% |
| Economic value (est.) | $111K | 92% |
September 2026 (month 36). Loan balance: $61K
| Collateral basis | Value | LTV |
|---|---|---|
| 3-yr SL book | $0 | n/m |
| 5-yr SL book | $120K | 50% |
| 6-yr SL book | $150K | 40% |
| Secondary market: 8 × $18–22K refurb, less about 10% disposition cost (est.) | $130–158K | 38–47% |
| Economic value, base (est.) | $186K | 33% |
| Economic value, downside (est.) | $93K | 65% |
| Economic value, upside (est.) | $312K | 19% |
March 2027 (month 42), mid-Rubin ramp. Loan balance: $31K
| Collateral basis | Value | LTV |
|---|---|---|
| 5-yr SL book | $90K | 34% |
| 6-yr SL book | $125K | 25% |
| Economic value, base (est.) | $147K | 21% |
| Economic value, downside (est.) | $69K | 45% |
The 4-year tenor did the real risk management. The loan stayed above water on economic value with 8 points to spare, and amortization pace bought every one of them. The depreciation schedule had nothing to do with it.
The cushion was also thinner than the book showed. A lender marking to book never saw how close it came.
Stretch the tenor and the risk comes back. On a 60-month amortization, the same loan hits about 116% LTV at the trough (est.). That's where a 6-year book life starts leaking into credit terms.
Years five through seven belong to someone else. After month 48 the residual, 16–76% of cost (est.), sits with the lessor or the equity. That's where the depreciation argument actually matters: residual assumptions, re-lease rates, fund NAV.
And a 3-year schedule isn't the conservative choice. It marks performing collateral at zero, trips covenants that shouldn't trip, and makes lenders over-reserve against boxes still throwing off cash.
What we recommend
Lenders: stay at 48 months or less, and size the advance to the downside economic-value curve at the bottom of the rate cycle, not to book. Lessors and CFOs: value the post-loan residual on an income approach, not at book.
How we'd run it:
- Mark quarterly on an income approach, and check it against secondary prints. Add a disposition haircut on the market side.
- Test the advance at the trough. 70% on a 48-month amortization survived a roughly 45% rate drop. A higher advance, a balloon or a longer term may not. Rerun the test through every generation transition: the Rubin ramp for Hopper, Rubin Ultra for Blackwell.
- Keep book depreciation for the P&L. Don't let a GAAP convention set your borrowing base. If the credit docs have to reference book, put a market-value test next to it.
- Underwrite the contract and the asset separately. A lease protects you until it ends. Then the residual rides on the re-lease rate, and that's the number that swings.
Independent GPU valuations
A depreciation schedule is a guess set on day one. This market reprices every quarter.
GPU Appraisals provides independent, market-based valuations of GPU servers for lenders, lessors and CFOs: collateral marks, residual-value and economic-life estimates, and portfolio reviews
For a defensible number, book 20 minutes or talk to GPU Appraisals about a valuation →
Disclosure: GPU Appraisals is affiliated with GPU Capital LLC, a private credit fund that invests in GPU servers. As USPAP requires, GPU Appraisals discloses any current or prospective interest in the subject property or the parties to the client before accepting an assignment.
Market data as of September 2026 from the sources linked above. Figures labeled "est." are GPU Appraisals derivations from stated assumptions, not observed market prices. This article is market commentary, not an appraisal, or investment, accounting or credit advice.